Strategic decisions are often guided by extensive data analysis and data visualization tools help with just that. Find top data visualization techniques to accelerate decision-making for businesses.
Contents
1. Simplifying Complex Data Sets with Data Visualization Tools
1.1 Benefits of Data Visualization Tools:
2. The Best Data Visualization Tools for Smarter Decision-Making
A. Understanding the Need for Data Visualization Tools
B. Key Factors to Consider
C. How to Evaluate and Select Data Visualization Tools?
2.1 AgencyAnalytics
2.2 ATLAS.ti
2.3 dataPARC
2.4 Echo AI (formerly Pathlight)
2.5 Evisions Argos
2.6 InetSoft Style Intelligence
2.7 Infogram
2.8 JMP
2.9 Minitab Connect
2.10 Pigment
2.11 Q Research Software by Displayr
2.12 TruOI
2.13 Vareto
2.14 Visme
2.15 Whatagraph
3. A Glimpse into the Future of Data Visualization
1. Simplifying Complex Data Sets with Data Visualization Tools
Data visualization platforms are the linchpins of effective business intelligence strategies. They translate complex data into a visual language, making it easily interpretable even for beginners in data analytics. These tools help uncover patterns, trends, and relationships that might take time to appear in raw numbers, enabling users to make quicker, more informed decisions.
1.1 Benefits of Data Visualization Tools:
-
Simplified Analysis: Data visualization tools transform complex data sets into visual formats like charts and graphs, making it easier to understand and interpret the data.
-
Enhanced Decision-Making: Visual representations help identify trends and patterns, enabling informed decisions based on clear and concise data.
-
Effective Communication: These tools allow complex data to be communicated to stakeholders in an understandable way, transcending language barriers.
-
Interactive Exploration: Users are able to interact with the data, manipulate variables, and uncover hidden insights, fostering a deeper understanding of the data.
These tools are essential for transforming performance metrics and extracting business intelligence. They enable analysts to identify trends and patterns that may not be apparent in raw data alone. By presenting data using the top data visualization techniques, in the form of pie graphs, flow charts, highlight tables, stack columns, and choropleth maps, among others, these tools provide a comprehensive overview of campaign performance, enabling marketers to identify areas for improvement and take appropriate action.
2. The Best Data Visualization Tools for Smarter Decision-Making
A. Understanding the Need for Data Visualization Tools
-
Data visualization tools are essential for efficient data analysis, revealing major trends and patterns.
-
They save time by automating the analysis of large-scale data, increasing productivity.
-
These tools help uncover minor anomalies and flaws in data, which translate into significant savings for companies.
B. Key Factors to Consider
-
The tool’s capacity to handle the volume, complexity, and format of your business data is crucial.
-
Consider the tool’s dashboard design and data connectivity. The dashboard is where visualizations are observed, and data connectivity determines how the data will be linked to the tool.
-
Also consider the cost of deployment and the tool’s adaptability.
C. How to Evaluate and Select Data Visualization Tools?
-
The type of data visualization task a user wants can guide the choice of tool.
-
The types of variables a business is analyzing and the audience for the visualization can also influence which tool will work best.
-
Remember, the right tool should strike a balance between analytical capabilities, technical performance, and cost.
Here are some of the data visualization tools to consider:
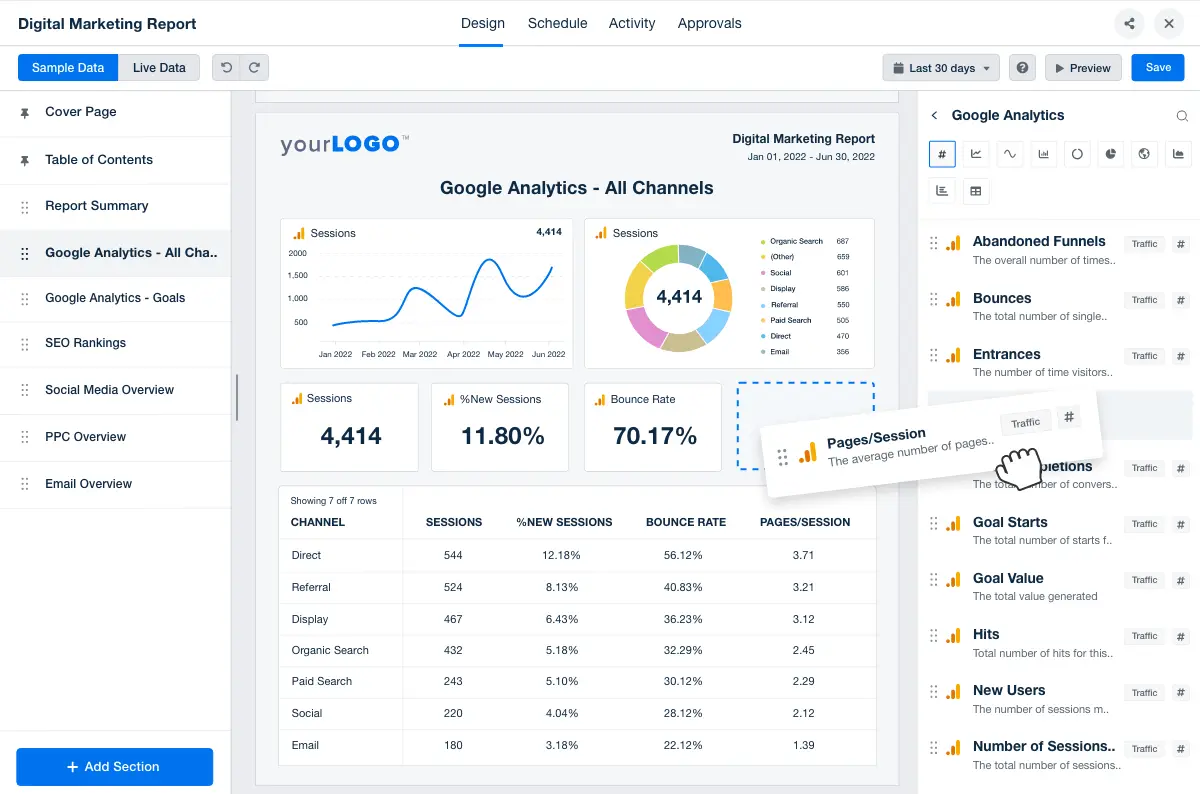
AgencyAnalytics is a powerful data visualization tool that has been transforming the way agencies present complex data. It's a tool that stands out for its ability to convert overwhelming data into interactive charts, graphs, and other easily digestible visuals. This tool has been instrumental in improving decision-making processes by revealing trends and patterns that might otherwise go unnoticed.
Features and Utility
-
Visual Appeal: AgencyAnalytics presents data in a visually appealing way, making it easier for clients to absorb important metrics and KPIs.
-
Automation: It automates the data collection process, saving time and effort.
-
Customization: The tool offers a variety of widgets and customization options, allowing agencies to tailor visuals to fit their specific clients’ needs.
-
Integration: AgencyAnalytics integrates with over 80 platforms to track and report on SEO, PPC, call tracking, social media, email marketing, ecommerce, local, and more.
-
SEO Tools: It includes a full suite of SEO tools designed to streamline and automate users’ agencies.
Real-World Impact
In real-world use cases, AgencyAnalytics has proven to be a valuable tool for agencies and marketing departments in various industries. It has been used to enhance client reports, making it easier for clients to digest complex information and paint a clearer path to decision-making. The tool has received positive reviews, indicating its effectiveness and popularity among users. With AgencyAnalytics, data-driven decision-making has been taken to the next level.
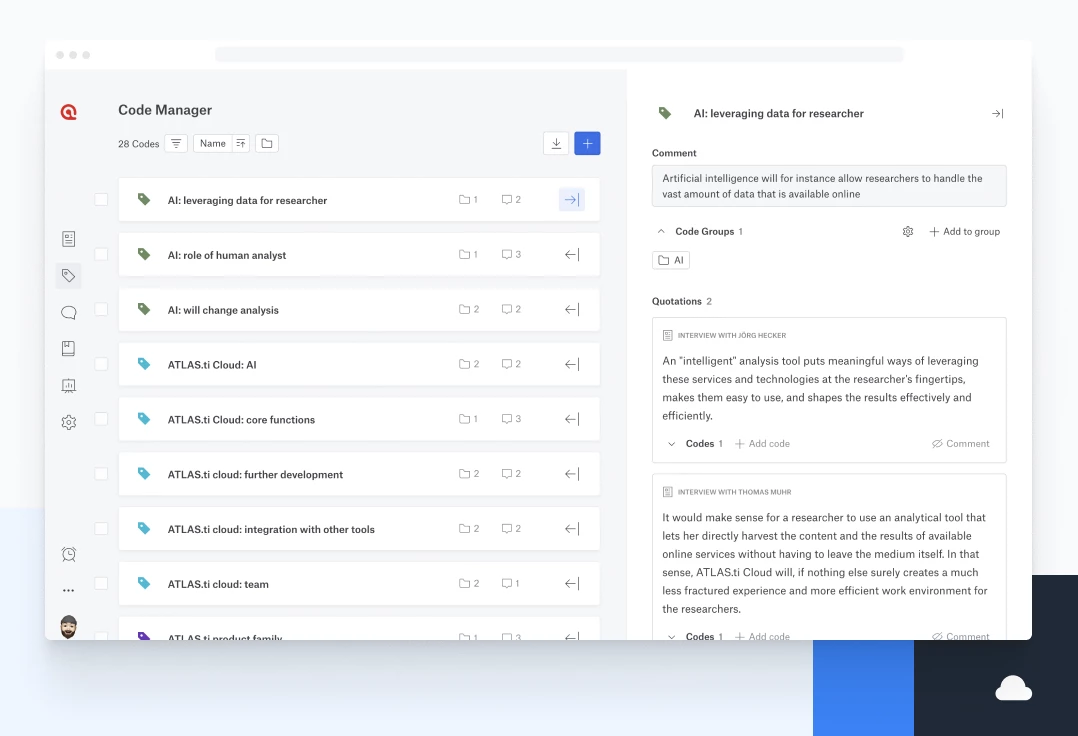
ATLAS.ti is a robust data visualization tool that has been revolutionizing the field of qualitative data analysis. It supports a wide range of data types and formats, making it a versatile tool for researchers and professionals alike. ATLAS.ti's ability to transform raw, unstructured data into meaningful insights has made it a go-to tool for many.
Features and Utility
-
Supports Multiple Data Types: ATLAS.ti can handle various data types in different formats.
-
Data Imports: It allows data imports from platforms like Twitter and Evernote.
-
Central Workspace: Provides a centralized workspace to organize all users’ data.
-
Coding: ATLAS.ti supports coding/tagging and annotating features within unstructured data.
-
Linking and Mind Maps: It offers linking and mind mapping capabilities for better data organization.
Real-World Impact
ATLAS.ti has been widely used in research fields for analyzing qualitative data. Its ability to create visual representations of complex data sets has made it a favorite among researchers. The tool has received positive reviews,indicating its effectiveness and popularity among users. With ATLAS.ti, qualitative data analysis has been elevated to a new level.
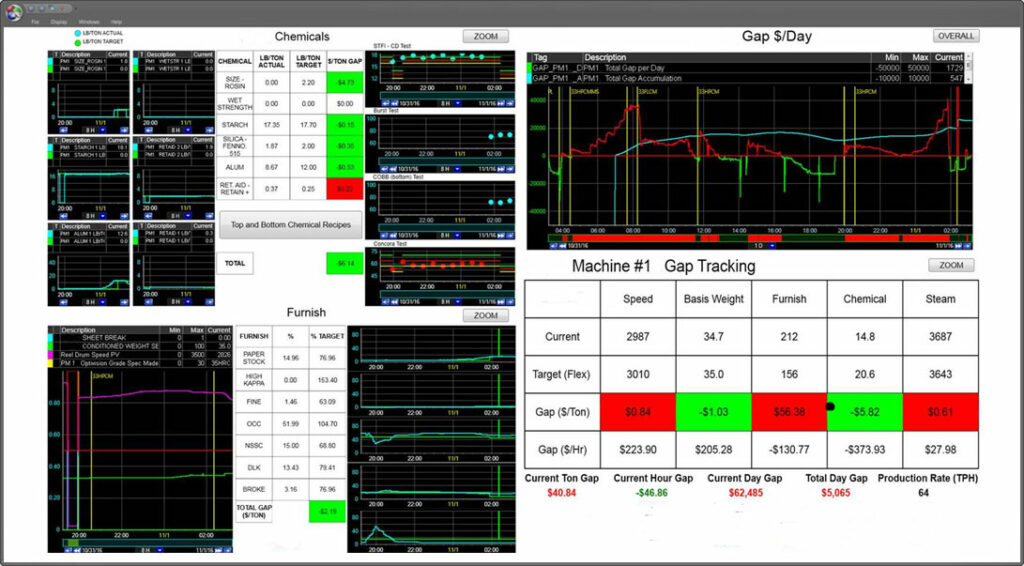
dataPARC is a comprehensive data visualization tool that has been making waves in the field of industrial data analysis. It's a self-service toolkit designed for process manufacturers seeking to improve quality, increase yield, and optimize their operations. dataPARC's ability to collect, connect, and analyze IoT data from across the plant has made it popular among professionals.
Features and Utility
-
Real-Time Visualization: dataPARC provides real-time data visualization, allowing users to monitor live data streams and making real-time decisions.
-
Data Integration: It can integrate data from any source, providing a single source of truth for all users’ manufacturing data.
-
Custom Displays: Users can build real-time dashboards and displays to monitor equipment status, site-level process flows, or enterprise-wide production KPIs.
-
Mobile Access: dataPARC brings powerful data visualization tools to mobile phones and tablets, enabling key personnel to respond to downtime events or monitor plant conditions remotely.
-
AI and Machine Learning: Leverage artificial intelligence and machine learning to drive continuous improvement and increase margins via predictive modeling.
Real-World Impact
In real-world, dataPARC has been widely used in various industries for analyzing industrial process data. It , indicates its effectiveness and popularity among users. With dataPARC, data-driven decision-making has been elevated to a new level.
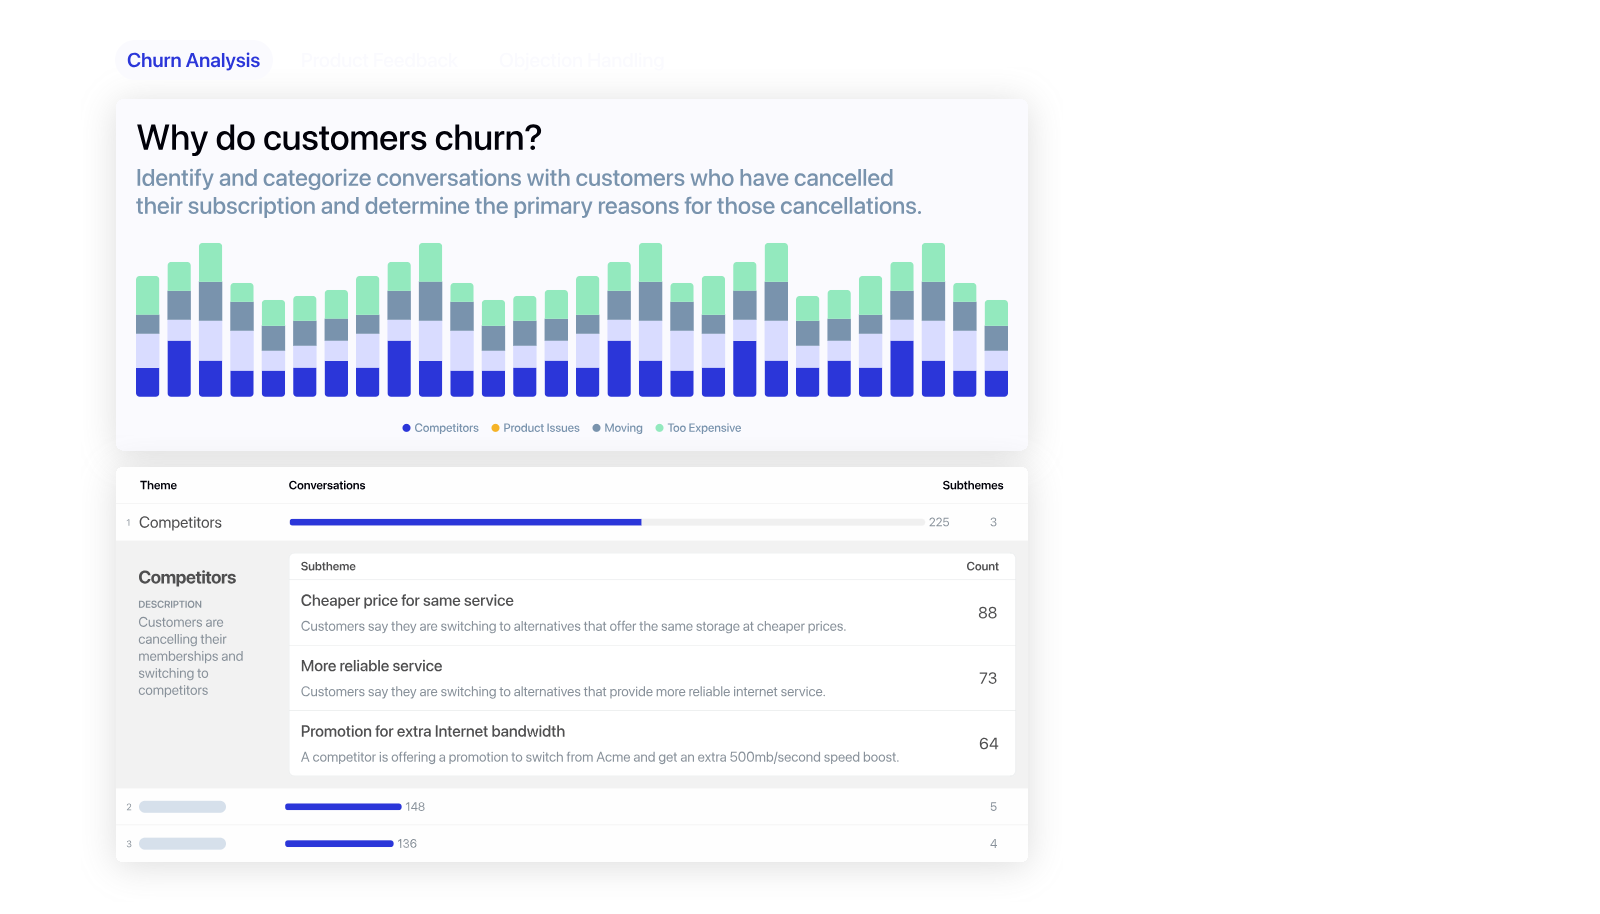
Echo AI, formerly known as Pathlight, is a cutting-edge data visualization tool that has been making a significant impact in the realm of unstructured data analysis. It's a web service that simplifies the process of gathering and analyzing unstructured data. Echo AI's ability to quickly analyze data about customers, employees, or anyone else on the internet has made it a valuable tool for many businesses.
Features and Utility
-
Data Collection: Echo AI allows companies to collect data about their customers, employees, or anyone else on the internet.
-
Data Analysis: It provides quick analysis of the collected data.
-
Data Storage: Echo AI stores data in Amazon S3, and one can access data stored in other storage systems, like a user’s laptop.
Real-World Impact
In real-world, Echo AI has been widely used for analyzing unstructured data.With Echo AI, data-driven decision-making has been significantly enhanced.
Evisions Argos is a leading data visualization tool that has been specifically designed for higher education. It provides flexible, powerful, and easy-to-use reporting tools that deliver the insights needed for timely, better-informed decisions. Argos has been widely appreciated for its ability to present student, departmental, and institutional data in real-time.
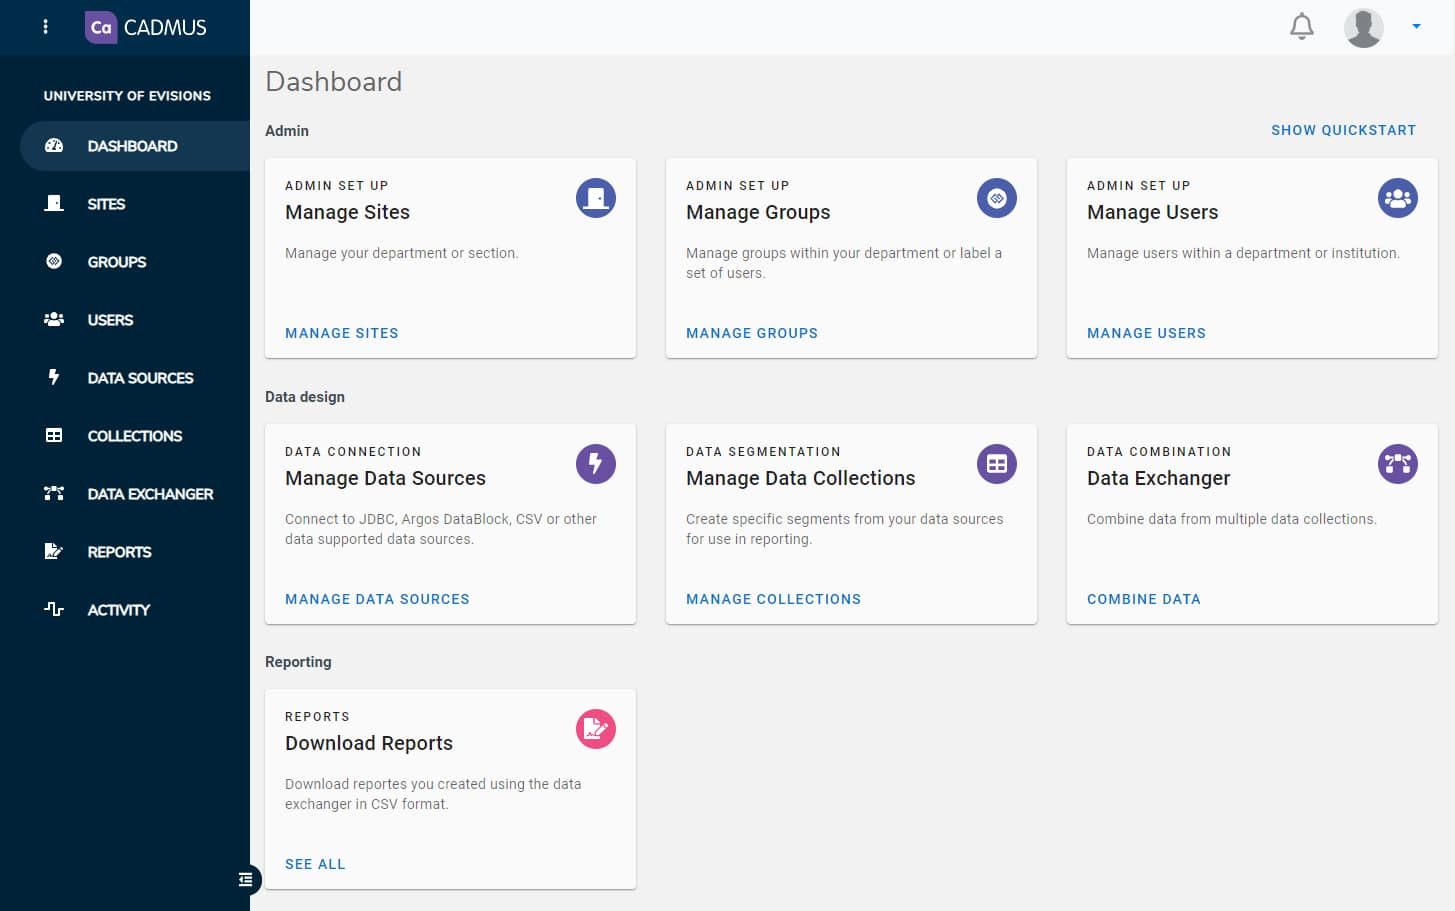
Features and Utility
-
Real-Time Data: Argos provides real-time data visualization, enhancing visibility throughout the institution.
-
Data Integration: It can connect with diverse data sources, streamlining data retrieval for reporting.
-
Customizable Dashboards: Users can build real-time dashboards and displays to monitor various metrics.
-
Email Reports: Argos allows scheduling of reports and emails, ensuring timely updates.
-
Data Manipulation: It supports insert, update, and delete operations, providing control over the user’s data.
Real-World Impact
Argos has been widely used in higher education institutions worldwide. For instance, Nicolet College has leveraged Argos for real-time reporting, enabling them to access data anytime, anywhere, and on any device. This has empowered them to make timely, data-driven decisions. With Argos, data-driven decision-making in higher education has been significantly enhanced.
InetSoft Style Intelligence is a powerful data intelligence platform that has been transforming the way businesses visualize and analyze their data. It's a tool that has been praised for its comprehensive power and fuss-free implementation, making it a favorite among both beginners and seasoned data analytics professionals.

The tool's core features include:
-
Interactive Dashboards: Enables users to create dashboards with drag-and-drop functionality.
-
Data Visualization: Allows users to create stunning visualizations to represent complex data sets.
-
Ad-Hoc Reporting: Enables users to generate ad-hoc reports on the fly.
-
Data Mashup: Rapid data preparation in-cloud and on-premise.
-
Self-Service Analytics and Reporting: Empowers business users with more self-service than dashboard interactivity and customization.
InetSoft Style Intelligence has been used in real-world cases to cumulate and assimilate data from various sources and formats, placing it in one convenient place. This has solved the problem of data management that other business intelligence tools could not
InetSoft Style Intelligence is not just a tool but a vital component in a data analytics professional's toolkit. Its ability to transform complex data into understandable visualizations makes it an essential tool for smarter decision-making.
Infogram is a user-friendly online tool that empowers individuals and teams to create beautiful and engaging infographics, charts, dashboards, and interactive reports. It's a tool that has been praised for its simplicity, functionality, and strong design aesthetic.
The tool's core features include:
-
Interactive Charts and Maps: More than 35 interactive charts and over 550 maps to help you visualize data.
-
Easy Drag-and-Drop Editor: An intuitive, lightweight data editor lets you easily edit colors and styles, add icons, and set display options.
-
One Million Images and Icons: A virtually endless supply of high-quality, royalty-free stock photos, icons, GIFs, flags, and more.
-
Collaboration: Invite team members to edit users’ projects, share folders, and create together.
-
Responsive Content: Infogram uses state-of-the-art technologies to offer the best possible experience for the web and mobile devices.
Infogram has been used extensively to create visually stunning and impactful projects that score in interactivity, precision, and visual appeal. It has proven to be a versatile and practical tool for a wide range of use cases.
In closing, Infogram is an important component in a data analytics professional's toolkit. Its ability to transform complex data into understandable visualizations makes it an essential tool for smarter decision-making.
JMP, a product of SAS, is a robust data analysis software that combines interactive visualization with powerful statistics. It's a tool that has been praised for its advanced computational statistics, automation and scripting, data management and integrity.
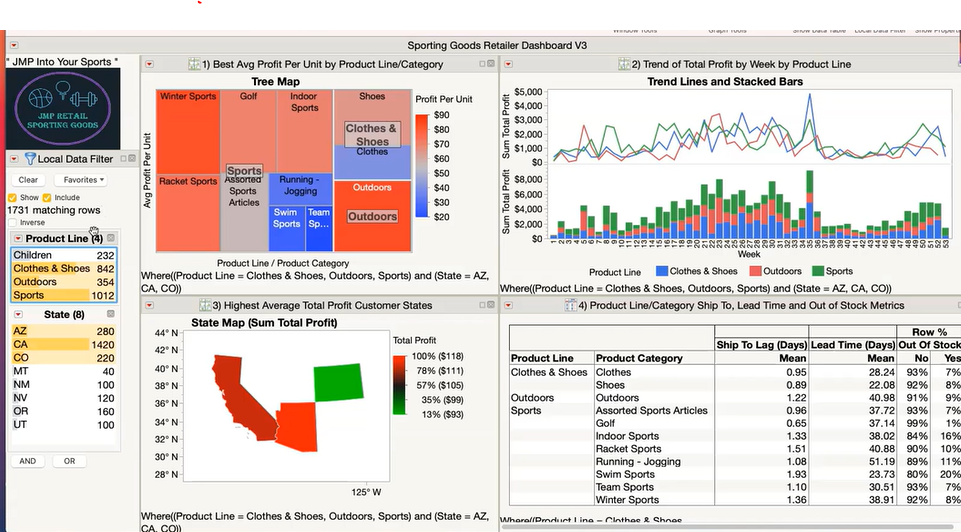
The tool's core features include:
-
Interactive Visualization: JMP provides dynamic, interactive graphics that allow users to see and explore their data.
-
Advanced Statistical Modeling: JMP offers a wide range of statistical models, making it a versatile tool for data analysis.
-
Data Acquisition: JMP allows easy access to data from various sources, making data preparation a breeze.
-
Automation and Scripting: JMP provides options for automating routine tasks, making data analysis more efficient.
-
Quality and Process Engineering: JMP is widely used in industries like manufacturing, finance, and pharmaceuticals for quality control and process optimization.
JMP has been used frequently to solve complex problems such as increasing yield or decreasing scrap in a manufacturing process, understanding which factors affect the quality of a product, or performing a root-cause analysis on equipment failures. It has proven to be a versatile and practical tool for a wide range of use cases.
As demonstrated, JMP is not just another tool, but a vital component in a data analytics professional's toolkit. Its ability to transform complex data into understandable visualizations makes it an essential tool for smarter decision-making.
Minitab Connect is a comprehensive data integration and automation solution that has been revolutionizing the way businesses manage and analyze their data. It's a tool that has been praised for its robust data integration capabilities, automation, and dashboarding solution.
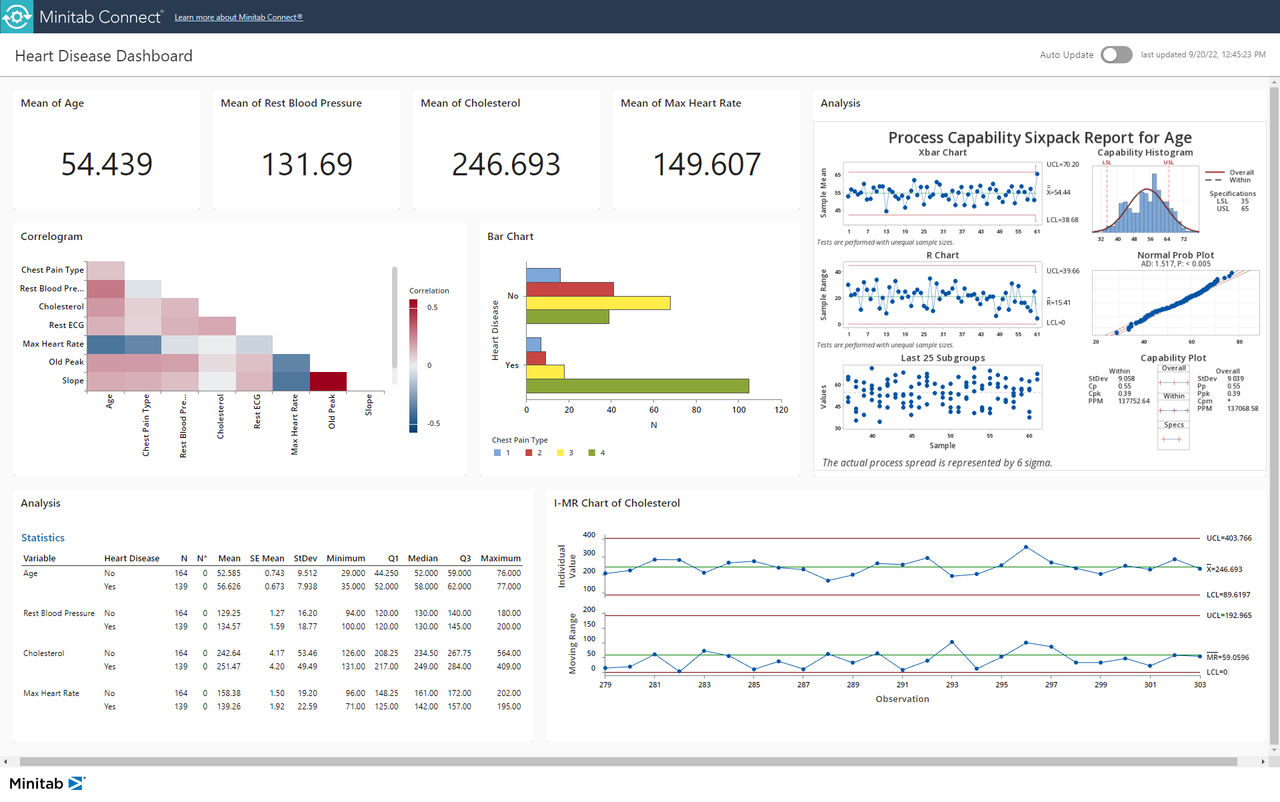
The tool's core features include:
-
Data Integration: Flexible data and file type options with scheduled and triggered ingestion.
-
Direct Data Entry: Validation for error reduction and data import management.
-
Data Preparation Tools: A wide range of tools for data cleaning and shaping.
-
Visualizations/Charts: A variety of charts are available for data visualization.
-
Access Controls and Permissions: Role-based user assignment and granular user group permissions.
Minitab Connect has been utilized to automate reports, track information for meaningful business intelligence, and instantly alert to changes requiring action. It has proven to be a versatile and practical tool for a wide range of use cases. To review, Minitab Connect is a significant phase of data visualization for data analysts. Its ability to streamline data integration and analysis makes it an essential tool for smarter decision-making.
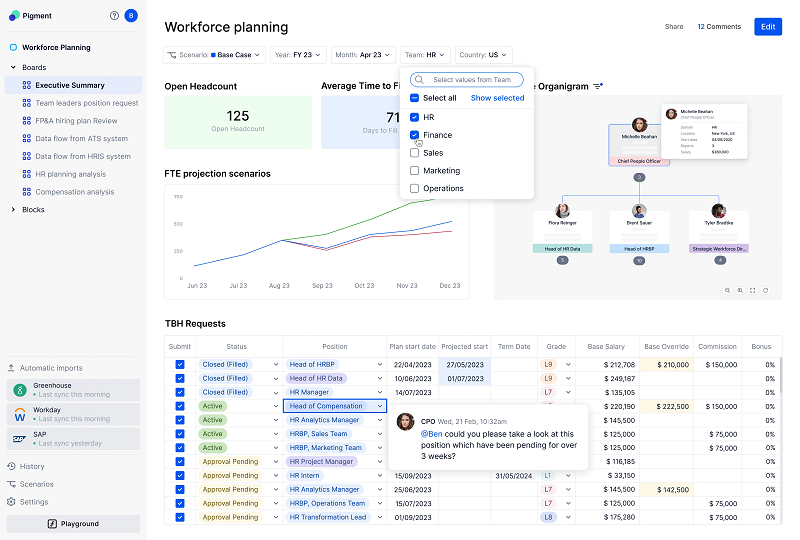
Pigment is a comprehensive business planning platform that has been making waves in the world of data analytics. It's a tool that has been praised for its intuitive, adaptable, and integrated platform, allowing teams to quickly build trusted strategic and operational business plans.
The tool's core features include:
-
Data Integration: Pigment brings together inputs from all users’ business apps and lets you clean and enrich data in seconds.
-
Real-Time Visualization: Build, maintain and visualize reports, plans and forecasts in real-time.
-
Comprehensive What-If Scenarios: Run comprehensive what-if scenarios in minutes, easily change assumptions and compare scenarios via beautiful tables and waterfall charts.
-
Collaboration: Overwrite quota assumptions, comment on the latest figures, and tag the user’s teammates to start live conversations.
-
Personalized Workflows: Gather everything and track progress with personalized workflows.
Pigment has been utilized to make confident and accurate decisions. It has proven to be a versatile and practical tool for a wide range of use cases.
Summing up, Pigment’s ability to streamline business planning and analysis makes it an essential tool for smarter decision-making.
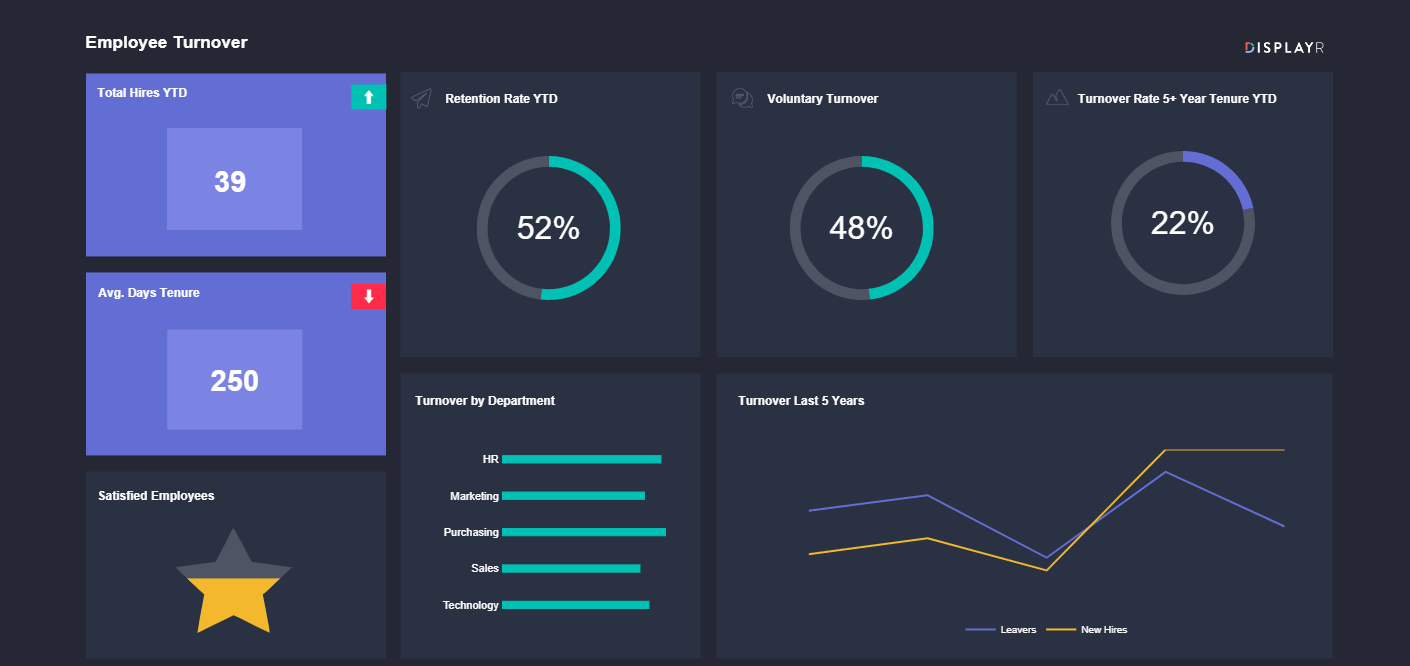
In the data visualization space, Q Research Software by Displayr stands out as a powerful tool for smarter decision-making. Users have praised its feature that makes survey analysis and reporting faster and simpler.
Key features of Q Research Software include:
-
Easy updating and automation: Automatically update reports when you get new data.
-
Full support of the R Language: Advanced users have the flexibility to do whatever computations they wish.
-
Simple to create and manipulate variables: Intuitive, drag-and-drop, point-and-click.
-
Statistical testing based on data type: Automatically performs appropriate statistical tests based on data type.
-
Seamless integration with PowerPoint: For exporting editable charts and tables.
Q Research Software has been used in real-world cases to analyze survey data, create crosstabs, and perform advanced analysis. It's a Windows application built specifically for the analysis of survey data. It's also tightly integrated with Displayr and PowerPoint for seamless reporting. This tool is essential in a data analytics professional’s toolkit, as it provides everything needed for data analysis. The software has received positive reviews for its efficiency and flexibility.
Finally, Q Research Software by Displayr is a robust tool that aids in the visualization and understanding of complex data, thereby empowering professionals to make smarter, data-driven decisions.
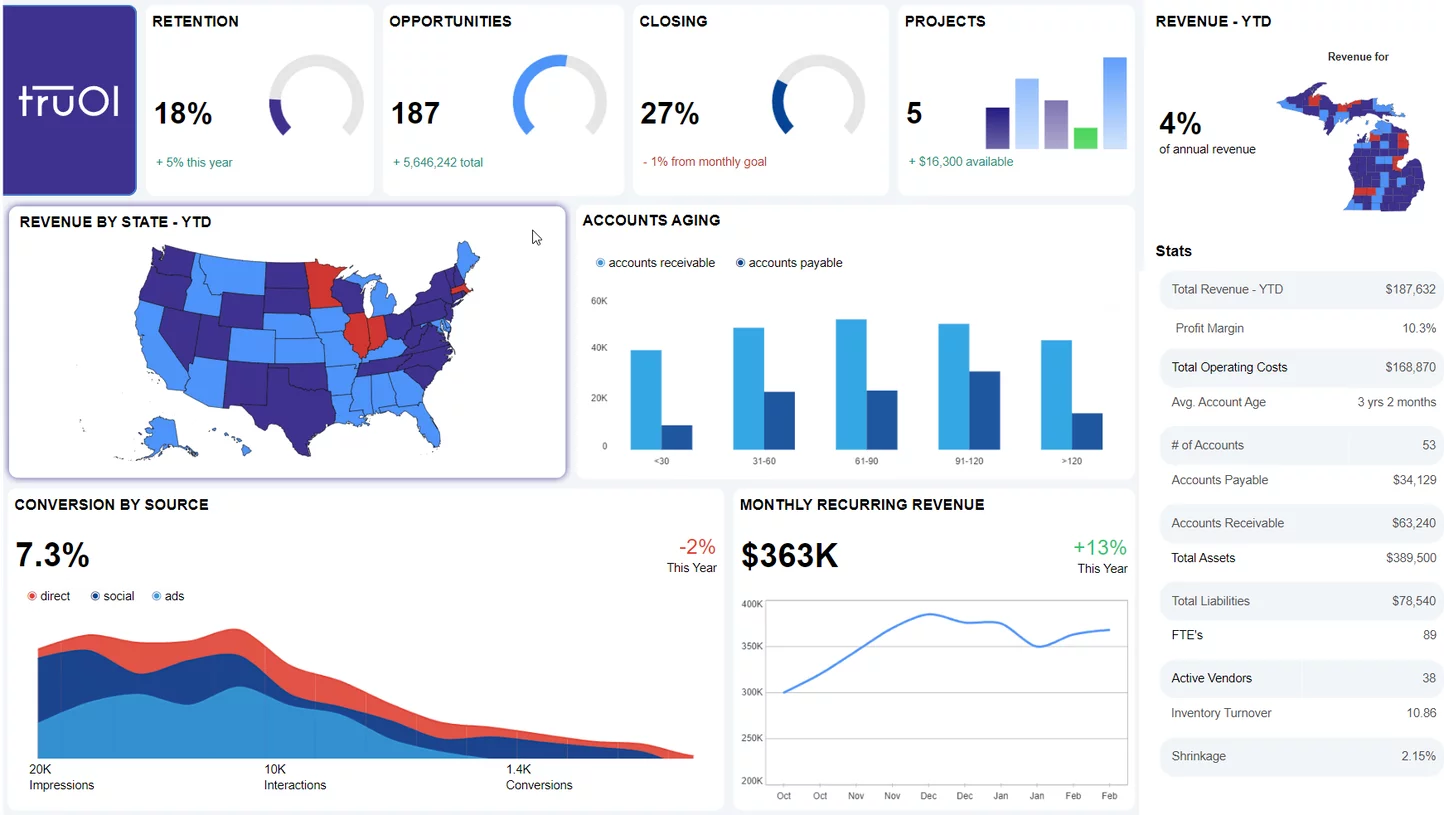
TruOI is a remarkable data visualization tool that integrates all users’ data and software systems into one unified platform. It's designed to streamline performance and increase corporate, unit, and team member profitability.
Key features of TruOI include:
-
Reports Interface: Intuitive and easy to use for standard and self-service reports.
-
Real-Time Updating: Track metrics in real time with consistent and frequent updates.
-
Graphs and Charts: Offers a variety of attractive graph and chart formats.
-
Score Cards: Visually track KPI's.
-
Dashboards: Provides business users with an interface to easily design, refine and collaborate on their dashboards.
TruOI has been used frequently to manage franchise growth and increase organizational profitability. It's a tool for managing franchise and chain operations. TruOI gathers all this data to create an interactive, company-wide performance management platform using their client's existing technology. This tool is essential in a data analytics professional’s toolkit, as it provides everything needed for data analysis. The software has received positive reviews for its usability and dashboard builder.
In the end, TruOI is a robust tool that aids in the visualization and understanding of complex data, thereby empowering professionals to make smarter, data-driven decisions.
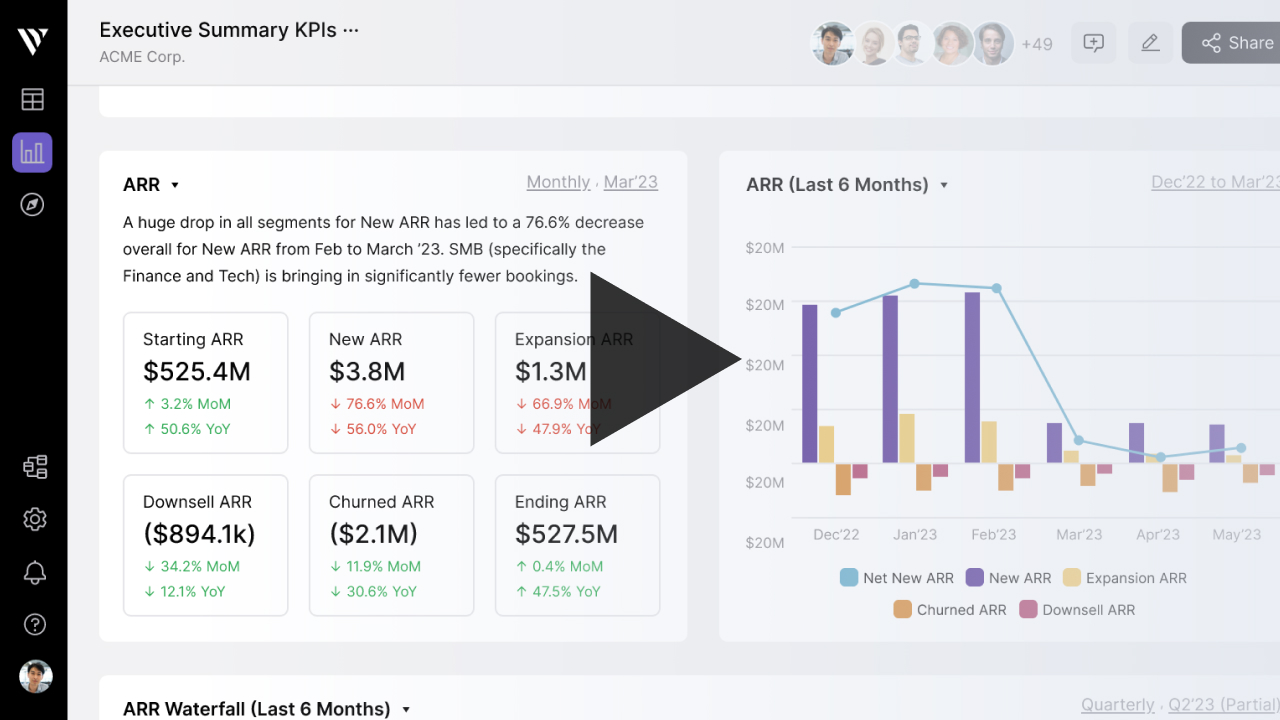
Vareto is a modern, intuitive FP&A platform for strategic finance and business teams to plan, forecast, and report on one source of truth. It's built for mid-market, high-growth, and enterprise teams and is designed to be flexible, customizable, and scalable as business needs evolve.
Key features of Vareto include:
-
Connected, Collaborative Planning: Streamline input gathering and feedback with workflows and real-time commenting.
-
Automated Reporting: Automate all of the user’s executive and departmental reporting.
-
Customizable Reports: Easily build any report you want in Vareto without using SQL or code.
-
Granular Access Permissions: Control who sees what.
-
AI-Generated Insights and Summaries: Save time with AI-generated insights and summaries.
Vareto has been used in real-world use cases to power company planning, reporting, and operational decision-making. It's a tool for strategic finance and business teams. Vareto gathers all this data to create an interactive, company-wide performance management platform using their client's existing technology. This tool is essential in a data analytics professional’s toolkit, as it provides everything needed for data analysis.
In conclusion, Vareto is a robust tool that aids in the visualization and understanding of complex data, thereby empowering professionals to make smarter, data-driven decisions.
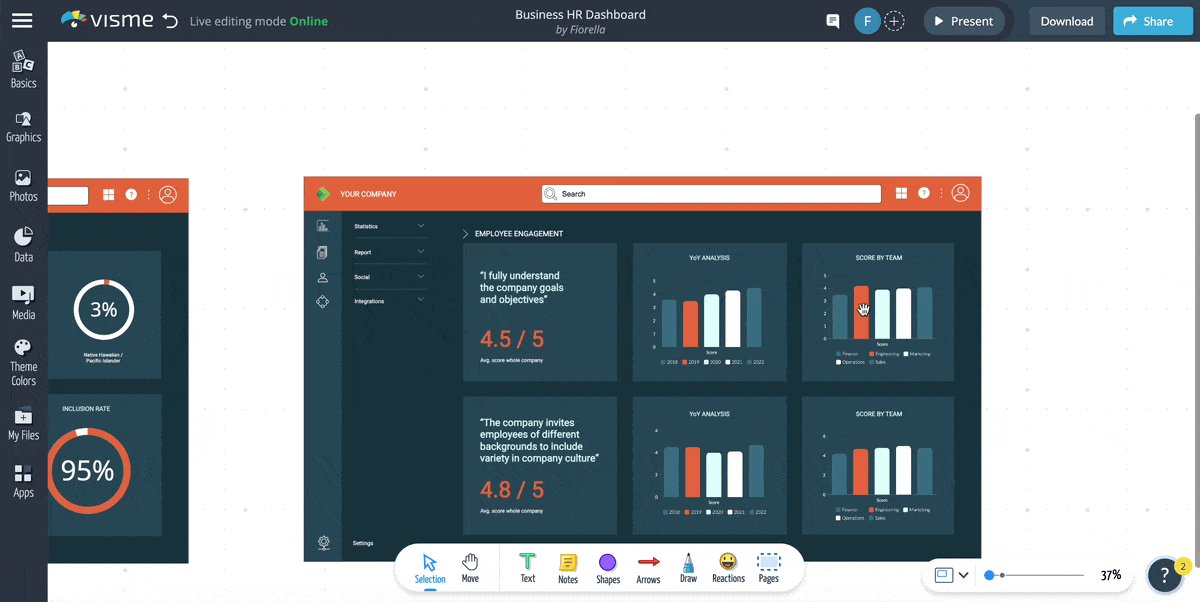
Visme is a versatile online tool for creating, editing, sharing, and storing visual materials. It's designed to cater to non-designers, making it easy to create beautiful presentations, infographics, visual documents, graphics, charts, and more.
Key features of Visme include:
-
Data Visualization: Transform data into engaging visuals.
-
Project Templates: Variety of templates for different projects.
-
Offline Mode: Work without an internet connection.
-
User Interface: Intuitive and easy to use.
-
Drag and Drop Functionality: Easily add elements to the user’s project.
Marketers have used Visme to produce compelling infographics for online campaigns, teachers have used it to create interactive presentations for use in the classroom, and non-profit organizations have used it to produce educational documents to further a cause. It's a tool that enables organizations and brands to produce high-quality visual assets, such as slideshow presentations, infographics, storyboards, and Facebook ads. This tool is essential in a data analytics professional’s toolkit, as it provides everything needed for data analysis. The software has received positive reviews for its usability, versatility, and quality of output.
All things considered, Visme is a robust tool that aids in the visualization and understanding of complex data, thereby empowering professionals to make smarter, data-driven decisions.
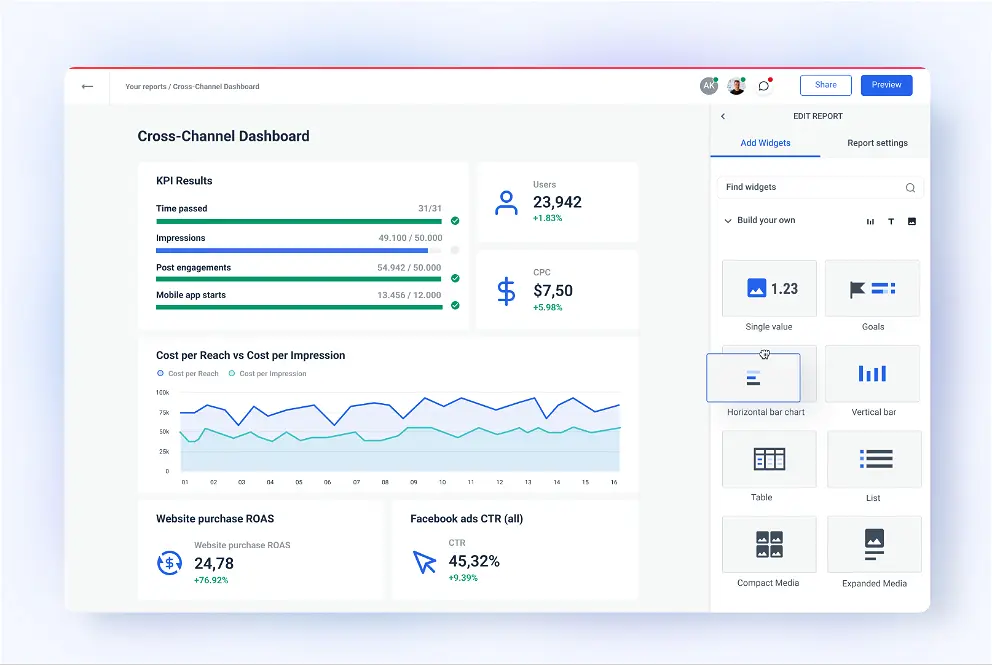
Whatagraph is an all-in-one intuitive marketing data platform that takes manual work and hassle away from the user’s process of connecting, organizing, visualizing, and sharing data. It's designed to cater to marketing agencies and large teams, making it easy to create visually clear and custom marketing reports.
Key features of Whatagraph include:
-
Data Visualization: Transform data into engaging visuals.
-
Data Automation: Automate all of the user’s executive and departmental reporting.
-
Custom Data Reporting: Easily build any report you want in Whatagraph without SQL or code.
-
Data Source Centralization: All users’ marketing data is in one place.
-
Integration: Direct native integrations with the user’s marketing sources.
Whatagraph has been used in real-world cases to manage and report marketing activities for various venues across countries. It's a tool for marketing agencies and in-house teams, so its features are tailored for this category of users. Whatagraph thrives in environments where visual data communication is paramount, particularly in client-facing scenarios or upper management presentations. This tool is essential in a data analytics professional’s toolkit as, it provides everything needed for data analysis. The software has received positive reviews for its ease-of-use, functionality, overall quality, and customer support.
As is clear by now, Whatagraph is a robust tool that aids in the visualization and understanding of complex data, thereby empowering professionals to make smarter, data-driven decisions.
3. A Glimpse into the Future of Data Visualization
Upon entering the next era of data-driven decision-making, the field of data visualization is poised for a transformative revolution. Emerging technologies such as artificial intelligence and machine learning are paving the way for a new generation of real-time data visualization tools. These tools will enhance the ability to understand complex data and revolutionize how businesses interact with it.
The role of AI and ML in automating data analysis and generating insights is becoming increasingly significant. The global market for AI in the data visualization industry is expected to reach $5.5 billion by 2022. This indicates a promising future for data visualization, with AI and ML playing a crucial role.
-
AI-Powered Insights: Future tools will use artificial intelligence to automatically analyze data and provide forecasts, helping you make better decisions for cloud databases.
-
Instant Data Views: These tools will offer live updates, giving you immediate insights into how the user’s cloud storage is performing.
-
Interactive 3D Models: Expect to see tools that use augmented and virtual reality to create engaging, three-dimensional views of cloud data structures.
-
Easy Access for All: Upcoming tools will be designed for ease of use, allowing everyone, regardless of technical skill, to create and understand data visualizations.
The future also holds exciting possibilities with the rise of interactive visualization and the increasing adoption of immersive technologies like virtual reality (VR) and augmented reality (AR). Interactive visualization allows users to manipulate and explore data in real time, providing insights that would be impossible with static visualizations. With these advancements, data visualization is set to transform performance metrics and help extract business intelligence at a glance.