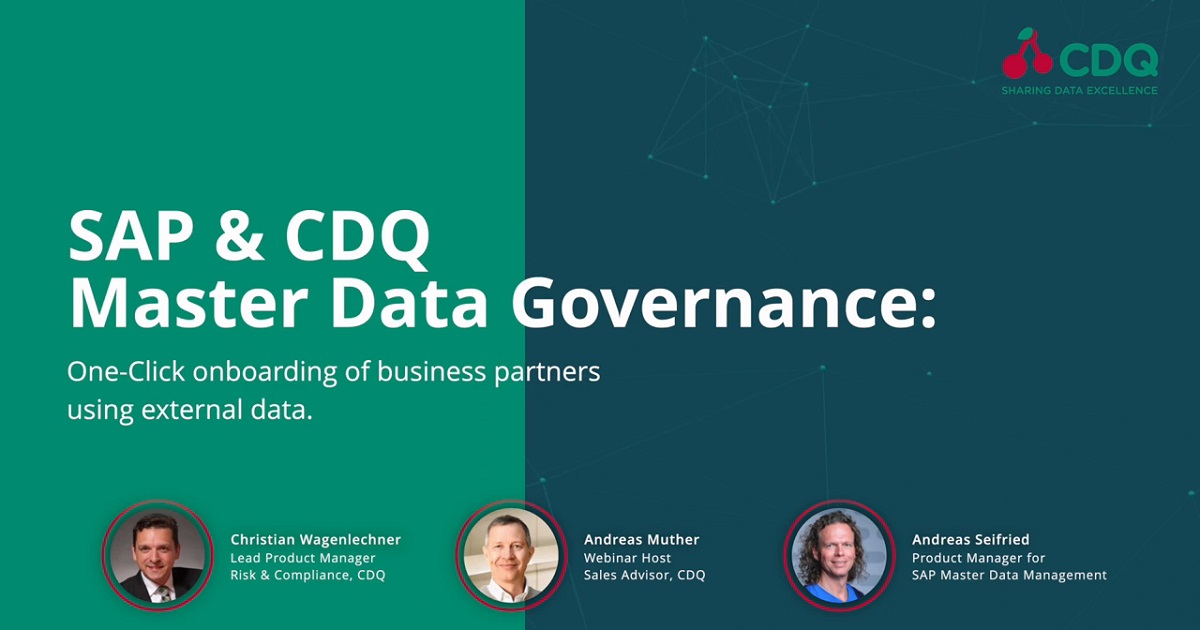
SAP and CDQ have joined forces to deliver a solution for efficient, accurate and quick business partner creation. Forget all the manual googling and document mining to get automated, reliable data. In this webinar, you get an opportunity to learn how this new standard of integrating external data into the SAP Master Data Governance can improve productivity and data quality for your organization.
Watch Now

From micromobility to last-mile delivery, mobility and transportation use cases are inherently geospatial. Whether you’re planning expansion into a new city or territory or optimizing rider / fleet operations, mobility companies are turning to spatial analytics to find greater profitability in a time of rapidly rising costs and fluctuating consumer demand.
Watch Now

To reduce the impact of an unfolding crisis, companies need a clear, accurate and early line of sight into emerging risks. Leaders can then act with confidence and seize opportunities to preserve brand reputation while driving operational excellence. To demonstrate how real-time information can help companies gain advanced warn
Watch Now

Arcadiadata
Geospatial data is everywhere today. Your mapping capabilities need to handle the growing volumes of “big data” to deliver location-based insights at any level. Large-scale mapping use cases require a scalable and real-time visualization platform that enables self-service analysis. End users need a fast, interactive system that can immediately display any view of their data on demand.
Watch Now